In this blog post, I want to introduce my new Github repository. This repository contains a python script to launch a GUI for calculating quantum yields. As a rule, I do prefer using things like jupyter notebook and/or python command line scripts to work with data. However, calculating relative quantum yields is one of those things I have found to be easier to work with in a GUI. Unfortunately (or perhaps fortunately for my experience benefit), I have yet to find a good software for this quite simple calculation.
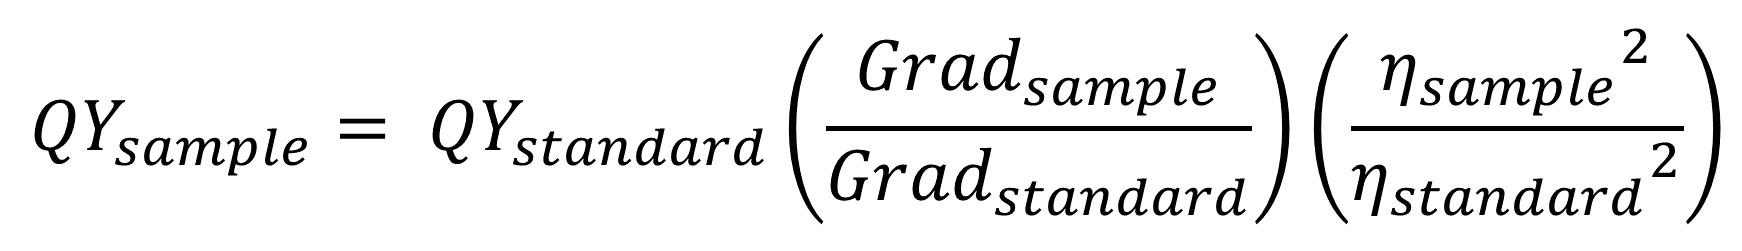
This method of finding fluorescence quantum yields is the comparative method,1 where a standard’s known quantum yield is used to find your sample’s unknown quantum yield. Thus, you need to acquire experimental UV-vis and fluorescence data for both your sample, and a standard of known quantum yield. Briefly, you choose an excitation wavelength to collect the fluorescence of your sample, and then you collect several UV-vis spectra in which you slowly increase the concentration of the sample in the cuvette each time, keeping the absorbance value at the chosen excitation wavelength between 0.01 and 0.1. At each concentration, you also collect a fluorescence spectrum of the sample. From these two sets of data, you can create a gradient curve, where the x-axis is the absorbance at the excitation wavelength, and the y-axis is the area under the fluorescence peak. The slope of this linear line is then used (along with a similar slope gathered for the standard) to solve for the quantum yield of the sample (see below figure).
This is a work in progress, and in the future, I would like to make this into (1) a JavaScript-based web-based application on this website, as well as (2) a stand-alone desktop application. However, as it stands currently, the QYcalculator has all the necessary features to aid researchers and thus I want to make it available.
Although the README on the Github (as well as the “Information” tab of the application) have decent How-to Guides, I want to take a little bit of time to show how to use the software. I have included in this repo an example data set, including six standard and sample UV-vis and fluorescence pairs of .csv files. I will assume that if you are reading this, you understand how to collect and save this experimental data. These experiments can be saved all in the same file, or in separate files.
It is important to note here that, to make the input format of experimental data as open as possible (i.e. coming from any instrument), you need to remove any headers or footers from your .csv files before using them as input to the software. Specifically, you need to go into your files and delete any column titles and gobbledygook at the end of the data, as the way the GUI parses the data files does not account for these being there. (See the example data sets as an example).
First, you will need to clone into the repo. If you are unfamiliar with Github, then you can follow this helpful and simple guide. Next, make sure you have the necessary dependencies (find a full list on the repo README). To use the app, there are four simple steps: (1) Launch via the command line (see README), (2) load and plot standard files, (3) load and plot sample files, and (4) plot the gradient curves and find the quantum yield.
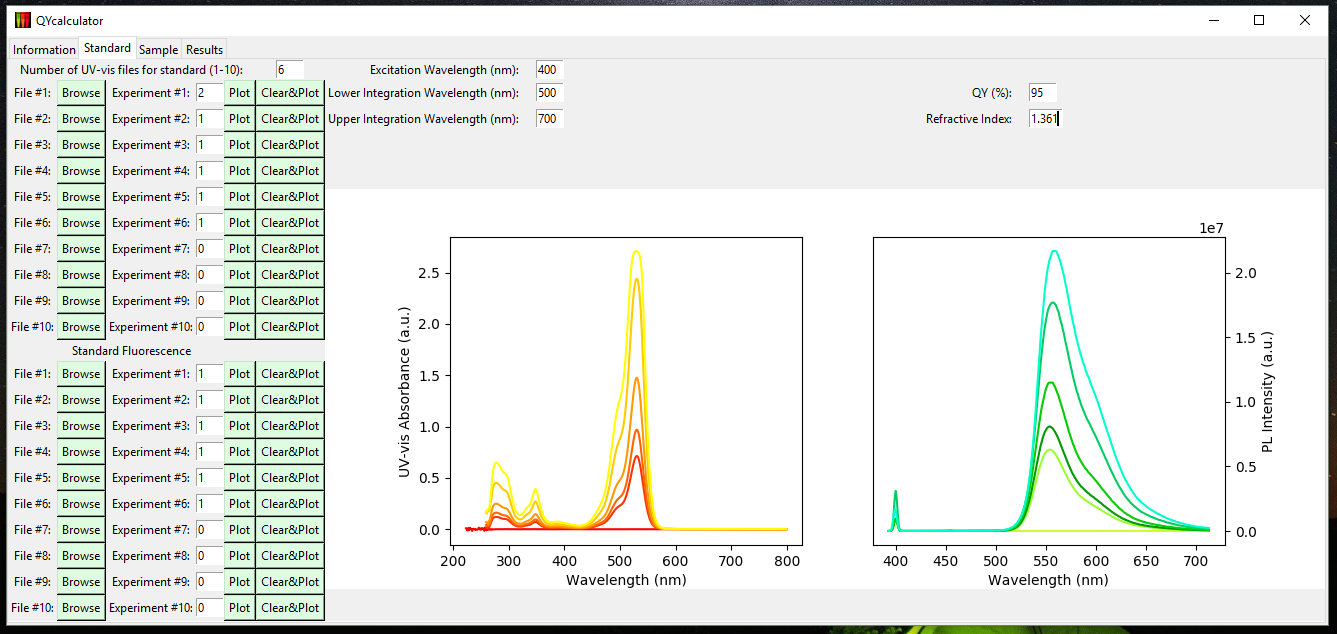
These steps are broken nicely into separate tabs for the standard and sample files, and for the resulting gradient curves and quantum yield. After you load in and plot your standard UV-vis, and Fluorescence files, the standard tab will look something like this:
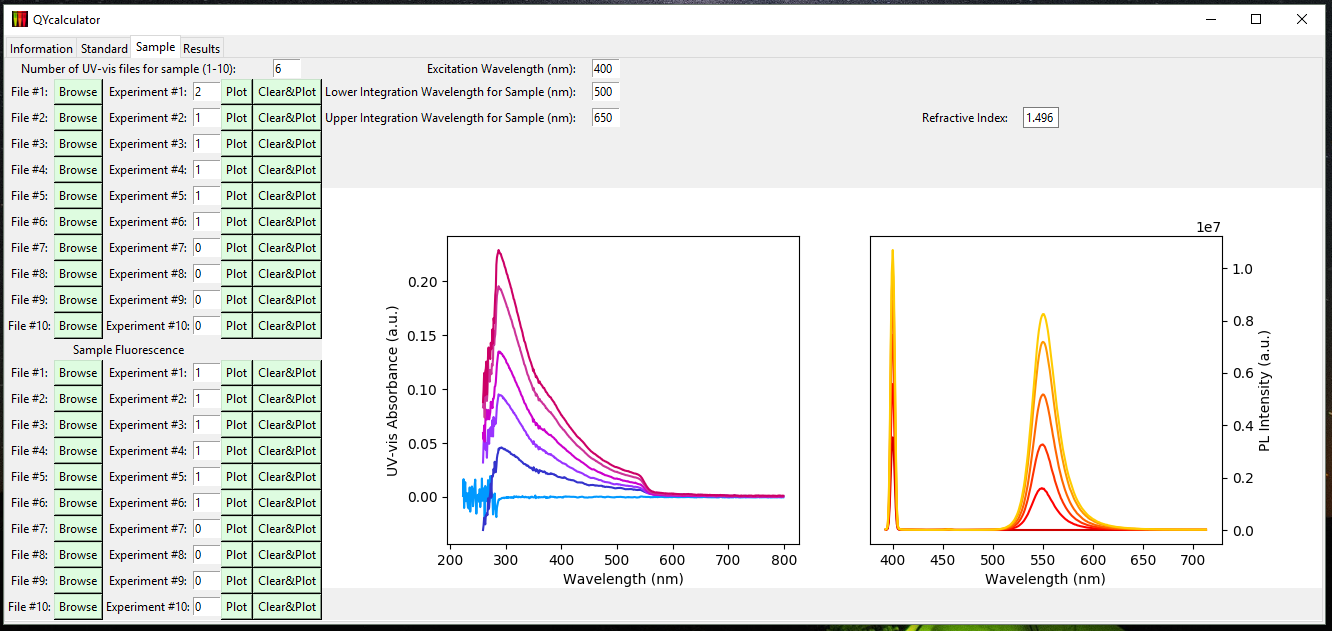
Similarly, after you load in and plot your sample UV-vis, and Fluorescence files, the sample tab will look something like this:
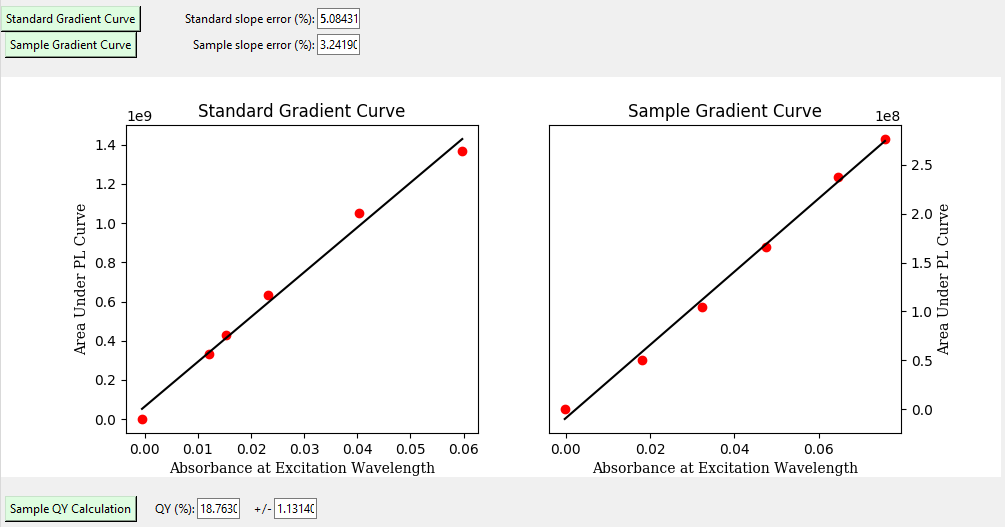
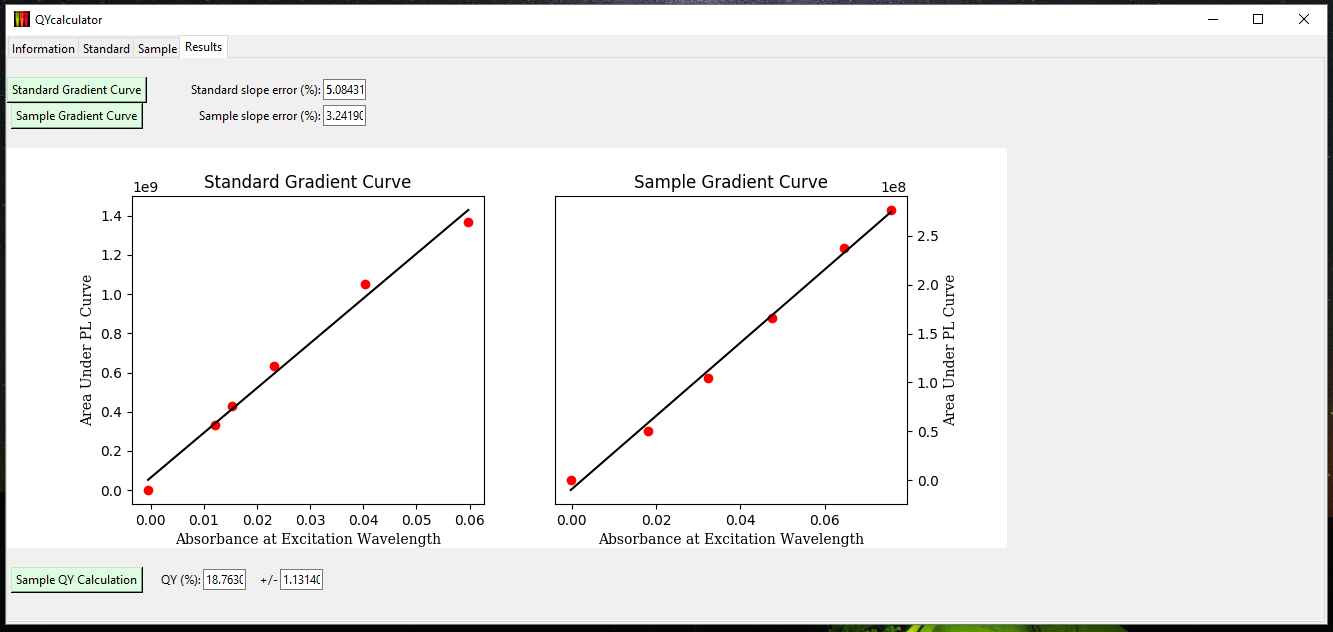
Lastly, you will navigate to the results tab where you will plot the gradient curves and find the quantum yield.
I hope that this app is simple and intuitive to use. If you have any issues, or suggestions, please feel free to contact me.
All thoughts and opinions are my own and do not reflect those of my institution.